Welcome to the official website of the Calcium-magnesium Fertilizer Branch of China Nitrogen Fertilizer Industry Association!


import and export
Hot News
In July, the national economy maintained a steady and progressive development trend.
(August 15, 2025)
National Bureau of Statistics
7 In the past month, under the strong leadership of the Party Central Committee with Comrade Xi Jinping at its core, all regions and departments have earnestly implemented the decisions and deployments of the Party Central Committee and the State Council, adhered to the general tone of seeking progress while maintaining stability, fully, accurately, and comprehensively implemented the new development philosophy, accelerated the establishment of a new development pattern, stepped up the implementation of more proactive and effective macro policies, and deepened efforts to build a nationwide unified market. As a result, the national economy has maintained a steady and progressive development trend, with sustained growth in both production and demand, overall stability in employment and prices, vigorous cultivation and expansion of new-quality productive forces, and new achievements in high-quality development.
I. Industrial production grew relatively rapidly, with equipment manufacturing and high-tech manufacturing showing strong development.
7 In the month, the value added of industrial enterprises above designated size nationwide increased year-on-year. 5.7% , month-on-month growth 0.38% Looking at the three major categories, the value added of the mining industry increased year-on-year. 5.0% Manufacturing growth 6.2% Growth in the electricity, heat, gas, and water production and supply industries 3.3% The value-added of the equipment manufacturing industry increased year-on-year. 8.4% The value-added growth of high-tech manufacturing. 9.3% , each faster than the total value-added of industrial enterprises above designated size. 2.7 and 3.6 percentage points. By economic type, the value added of state-controlled enterprises increased year-on-year. 5.4% ; Growth of joint-stock enterprises 6.5% Growth of foreign-invested and Hong Kong, Macao, and Taiwan-invested enterprises 2.8% ; Growth of private enterprises 5.0% By product, 3D The output of printing equipment, industrial robots, and new-energy vehicle products increased year-on-year, respectively. 24.2% 、 24.0% 、 17.1% 。 1-7 In the month, the value added of industrial enterprises above designated size nationwide increased year-on-year. 6.3% 。7 In the month, the manufacturing purchasing managers’ index was 49.3% The expected index for business production and operations activities is 52.6% 。 1-6 In the month, the total profits of industrial enterprises above designated size nationwide were realized. 34365 100 million yuan, down year-on-year 1.8% 。
II. The service sector has grown relatively rapidly, and modern service industries are showing strong growth momentum.
7 In the month, the nationwide index of service-sector production rose year-on-year. 5.8% By industry, the production indices for information transmission, software and information technology services, the financial industry, and the leasing and business services sector increased year-on-year by: 11.9% 、 8.7% 、 8.0% , both faster than the services production index 6.1、2.9、2.2 percentage point. 1-7 In the month, the nationwide index of service-sector production rose year-on-year. 5.9% 。 1-6 In the month, the operating revenue of service enterprises above a designated size increased year-on-year. 7.5% 。7 The monthly business activity index for the service sector is 50.0% The expected index of business activity in the service sector is 56.6% Among these, the business activity indices for industries such as railway transportation, air transportation, postal services, and culture, sports, and entertainment are located at... 60.0% The above-mentioned high-level prosperity range.
III. Market sales continue to grow, with retail services experiencing relatively rapid growth.
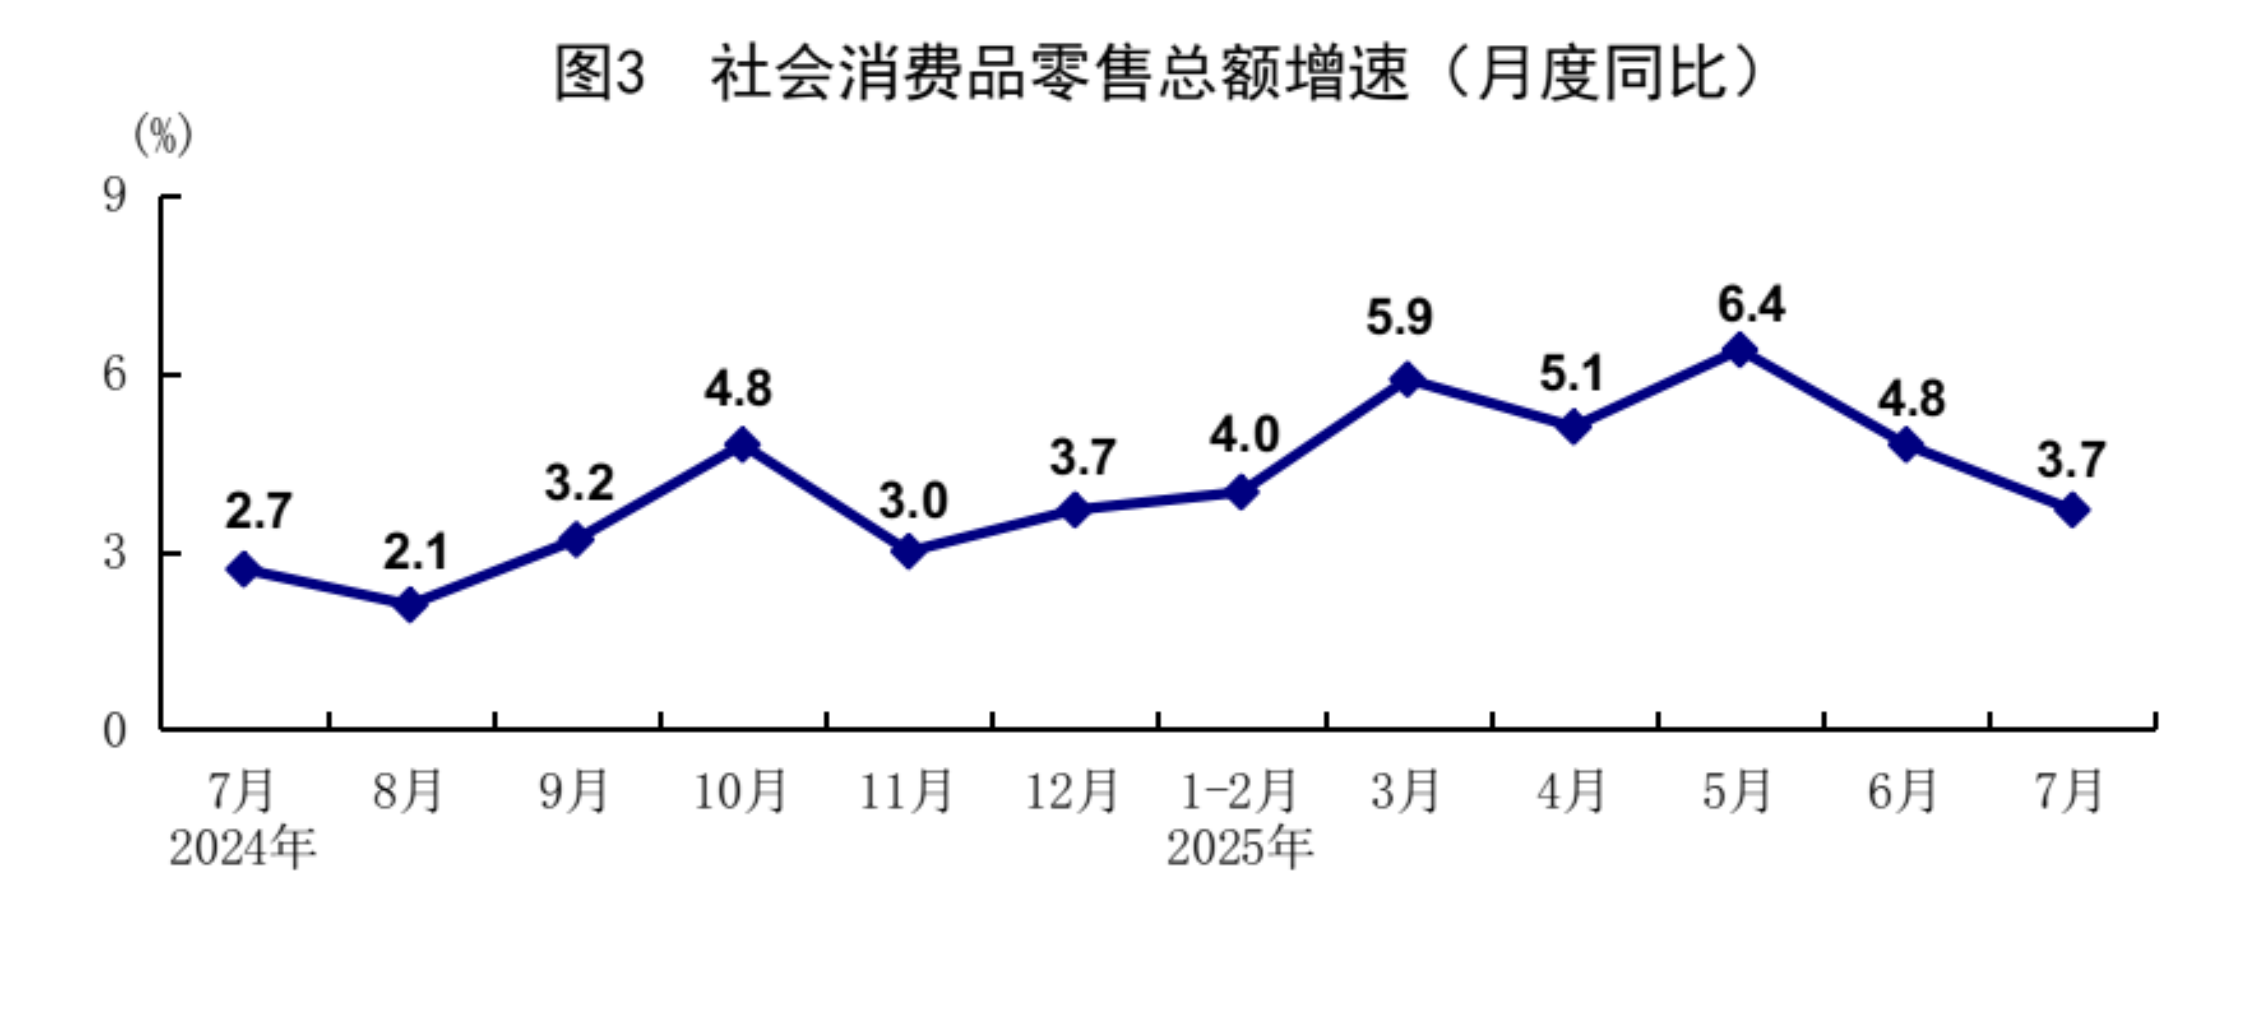
7 Month, total retail sales of consumer goods 38780 100 million yuan, up year-on-year 3.7% ; Down from the previous month 0.14% By location of the operating entity, retail sales of consumer goods in urban areas 33620 100 million yuan, up year-on-year 3.6% ; Retail sales of consumer goods in rural areas 5160 100 million yuan, growth 3.9% By type of consumption, retail sales of goods 34276 100 million yuan, growth 4.0% ; Food and beverage revenue 4504 100 million yuan, growth 1.1% Sales of basic living goods and certain upgraded products showed strong growth. Retail sales of grain, oil, and food items, daily necessities, sports and entertainment goods, and gold, silver, and jewelry—all at enterprises above the designated size—increased respectively. 8.6% 、 8.2% 、 13.7% 、 8.2% The consumer goods trade-in policy continues to show positive effects, with retail sales of household appliances and audiovisual equipment, furniture, telecommunications equipment, and cultural and office supplies—among units above the designated size—growing respectively. 28.7% 、 20.6% 、 14.9% 、 13.8% 。 1-7 Month, total retail sales of consumer goods 284238 100 million yuan, up year-on-year 4.8% National online retail sales 86835 100 million yuan, up year-on-year 9.2% Among them, online retail sales of physical goods 70790 100 million yuan, growth 6.3% , accounting for a share of the total retail sales of consumer goods in society of 24.9% 。 1-7 In the month, retail sales of services increased year-on-year. 5.2% Among these, retail sales in the categories of cultural and leisure services, telecommunications and information services, tourism consulting and rental services, and transportation and travel services grew relatively rapidly.
IV. Fixed-asset investment continued to expand, with manufacturing investment growing relatively rapidly.
1-7 Month, nationwide fixed-asset investment (excluding rural households) 288229 100 million yuan, up year-on-year 1.6% Excluding real estate development investment, nationwide fixed-asset investment grew. 5.3% By sector, infrastructure investment increased year-on-year. 3.2% Manufacturing investment grows. 6.2% Real estate development investment declined. 12.0% The nationwide sales area of newly built commercial residential properties. 51560 Ten thousand square meters, down year-on-year. 4.0% ; Sales of newly built commercial properties 49566 100 million yuan, down 6.5% By industry, investment in the primary sector increased year-on-year. 5.6% Investment in the secondary sector grows. 8.9% Investment in the tertiary sector declined. 2.3% Private investment declined year-on-year. 1.5% Excluding real estate development investment, private investment grew. 3.9% In the high-tech industry, investments in the manufacturing of aircraft, spacecraft and equipment, information services, and computer and office equipment manufacturing increased year-on-year by, respectively, ... 33.9% 、 32.8% 、 16.0% 。7 In the month, fixed-asset investment (excluding rural households) declined month-on-month. 0.63% 。
V. Growth in imports and exports of goods has accelerated, and the trade structure continues to improve.
7 Month, total value of goods imports and exports 39102 100 million yuan, up year-on-year 6.7% Among them, exports 23077 100 million yuan, growth 8.0% ; import 16026 100 million yuan, growth 4.8% 。 1-7 Month, total value of goods imports and exports 256969 100 million yuan, up year-on-year 3.5% Among them, exports 153048 100 million yuan, growth 7.3% ; import 103922 100 million yuan, down 1.6% 。 1-7 In the month, imports and exports of general trade grew. 2.1% , accounting for a share of the total import and export volume of 64.0% Imports and exports to countries jointly building the “Belt and Road” have grown. 5.5% Private enterprises see growth in imports and exports. 7.4% , accounting for a share of the total import and export volume of 57.1% , an increase compared to the same period last year 2.1 Percentage points. Growth in electromechanical product exports 9.3% , accounting for a share of total exports of 60.0% 。
6. The employment situation remains generally stable, with the urban surveyed unemployment rate showing a seasonal increase.
1-7 In the month, the average urban surveyed unemployment rate nationwide was 5.2% 。7 Month, the national urban surveyed unemployment rate was 5.2% , up from the previous month 0.2 percentage points, unchanged from the same month of the previous year. The surveyed unemployment rate for locally registered labor force is... 5.3% ; The surveyed unemployment rate for migrant workers with registered household status is 5.1% Among them, the surveyed unemployment rate for migrant agricultural household laborers is 4.9% 。31 The surveyed unemployment rate in large cities and towns is 5.2% , up from the previous month 0.2 percentage points, down from the same month of the previous year 0.1 percentage points. The average weekly working hours for employed persons in enterprises nationwide are... 48.5 Hour.
7. Resident consumer prices remained flat year-on-year; core... CPI Continuous recovery
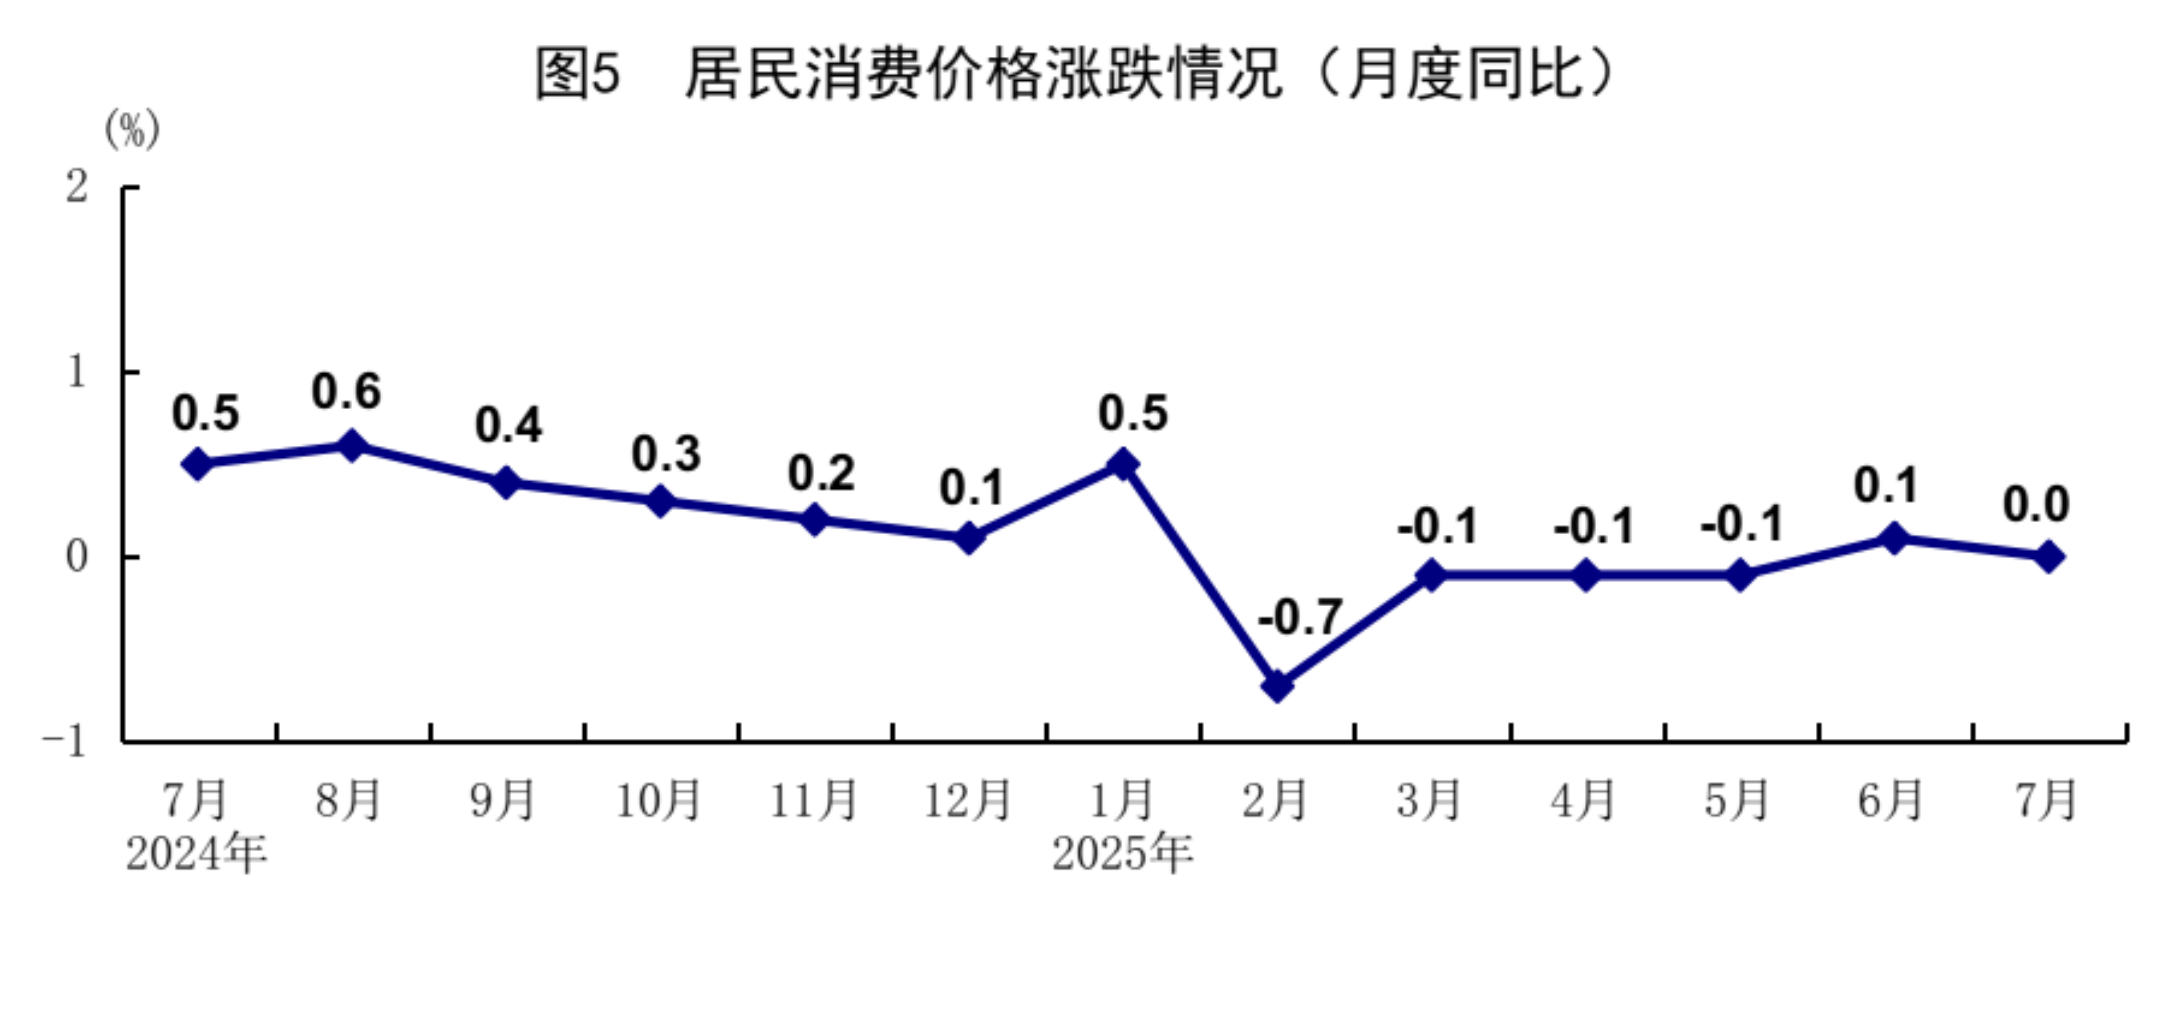
7 Month, the national consumer price index ( CPI ) Same as last year, up from the previous month. 0.4% By category, food, tobacco, and alcohol prices fell year-on-year. 0.8% Clothing prices are rising. 1.7% Residential prices are rising. 0.1% Prices of daily necessities and services have risen. 1.2% Transportation and communication prices have fallen. 3.1% Education, culture, and entertainment prices have risen. 0.9% Healthcare prices are rising. 0.5% Prices of other goods and services rose. 8.0% Among food, tobacco, and alcohol prices, pork prices have declined. 9.5% Fresh vegetable prices have fallen. 7.6% Food prices have fallen. 1.0% Fresh fruit prices have risen. 2.8% Core, excluding food and energy prices CPI Year-on-year increase 0.8% The increase widened compared to the previous month. 0.1 percentage point. 1-7 In the month, the national consumer price index fell year-on-year. 0.1% 。
7 In the month, the nationwide ex-factory price of industrial producers fell year-on-year. 3.6% , down month-on-month 0.2% ; The national industrial producer purchase prices fell year-on-year. 4.5% , down month-on-month 0.3% 。 1-7 In the month, the national ex-factory prices and purchase prices of industrial producers both declined year-on-year. 2.9% 、 3.2% 。
Overall, 7 In the current month, macro policies have begun to yield tangible results. Thanks to these efforts, China’s national economy has managed to overcome adverse impacts such as the complex and volatile external environment and extreme weather conditions at home, maintaining a steady yet progressive development trajectory and demonstrating strong resilience and vitality. At the same time, we must recognize that the external environment remains complex and severe, and the economy continues to face numerous risks and challenges. In the next phase, we must remain guided by Xi Jinping Thought on Socialism with Chinese Characteristics for a New Era, adhere to the general tone of seeking progress while maintaining stability, fully, accurately, and comprehensively implement the new development philosophy, accelerate the establishment of a new development pattern, and thoroughly carry out the decisions and deployments of the Party Central Committee and the State Council. We should ensure that all policies are implemented meticulously and effectively, focusing on stabilizing employment, businesses, markets, and expectations, tapping into the potential of domestic demand, and powerfully promoting the dual circulation—both domestic and international—thus driving the economy toward stable and healthy development.
Note
(1) The growth rates of value-added industrial output above a designated size and its categorized items, calculated at comparable prices, represent real growth rates. All other indicators, unless otherwise specified, are calculated at current prices and represent nominal growth rates.
(2) The statistical scope for industrial enterprises above a designated size includes industrial enterprises with annual principal business revenue of 20 million yuan or more.
Since the scope of industrial enterprises above a designated size changes annually, to ensure comparability between this year’s data and last year’s, the corresponding figures used for calculating year-on-year growth rates of indicators such as product output are aligned as closely as possible with the current statistical coverage of enterprises. Consequently, there are differences in caliber compared to the data published last year. The main reasons are: First, the scope of statistical units has changed. Each year, some enterprises meet the size criteria and are included in the survey scope, while others fall below the threshold and are removed from the survey. Additionally, newly established enterprises that begin production, bankrupt enterprises, and enterprises whose licenses have been revoked or suspended also affect the scope. Second, for certain enterprise groups (companies), there is a phenomenon of double-counting of product output across different regions. To address this issue, a special survey was conducted to eliminate duplicate counts of output across regions for these enterprise groups (companies).
(3) The service sector production index refers to the change in output of the service sector during the reporting period, adjusted for price factors, relative to the base period.
(4) The statistical scope of total retail sales of consumer goods includes legal entities, industrial activity units, and individual business households engaged in retail sales of goods or providing catering services. Among these, enterprises above the specified threshold refer to wholesale enterprises (units and individual business households) with annual main business revenue of 20 million yuan or more, retail enterprises (units and individual business households) with annual main business revenue of 5 million yuan or more, and accommodation and catering enterprises (units and individual business households) with annual main business revenue of 2 million yuan or more.
Since the scope of wholesale and retail enterprises, as well as accommodation and catering enterprises (units and individual businesses) above the prescribed threshold changes annually, in order to ensure comparability of this year’s data with last year’s, the corresponding period figures used to calculate the year-on-year growth rates of various indicators, such as retail sales of consumer goods by enterprises above the threshold, are consistent with the statistical coverage of enterprises (units and individual businesses) for the current period. Consequently, there are differences in caliber between this year’s data and the data published last year. The main reasons for these differences are that each year some enterprises (units and individual businesses) meet the threshold criteria and are included in the survey scope, while others fall below the threshold due to shrinking size and thus are excluded from the survey. Additionally, newly established enterprises, bankrupt enterprises, and enterprises (units and individual businesses) whose licenses have been revoked or suspended also contribute to these changes in scope.
Online retail sales refer to the total retail sales of goods and services realized through public online trading platforms (including self-built websites and third-party platforms). Goods and services include both physical goods and non-physical goods (such as virtual goods and service-based products).
The total retail sales of consumer goods include online retail sales of physical goods but exclude online retail sales of non-physical goods.
Based on the results of the Fifth National Economic Census, the total retail sales of consumer goods and online retail sales data have been revised. In 2025, the monthly growth rates of these relevant indicators—total retail sales of consumer goods and online retail sales—will be calculated using comparable bases.
(5) Retail sales of services refer to the total value of services provided directly by enterprises (industrial activity units and individual businesses) in the form of transactions to individuals and other entities for non-production and non-business purposes. This metric aims to reflect the monetary value of consumer-oriented services sold by service providers, including retail sales of services in sectors such as transportation, accommodation, catering, education, healthcare, sports, and entertainment.
(6) In accordance with the revised investment statistical methodology, the Fifth National Economic Census, and statistical enforcement inspections, the fixed-asset investment data for the same period last year have been revised. The growth rate of fixed-asset investment is calculated using a comparable base.
(7) Import and export data are sourced from the General Administration of Customs.
(8) Employed persons are those aged 16 and above who are capable of working and engage in certain social labor in exchange for wages or business income.
(9) Due to rounding, there may be discrepancies between the total and the sum of individual items for some data.
Appendix
Key Indicator Data for January–July 2025
Indicator | July | January-July | ||
|---|---|---|---|---|
Absolute quantity | Year-on-year growth (%) | Absolute quantity | Year-on-year growth (%) | |
I. Value-added of industrial enterprises above designated size | … | 5.7 | … | 6.3 |
Divided into three major categories |
|
|
|
|
Mining industry | … | 5.0 | … | 5.8 |
Manufacturing | … | 6.2 | … | 6.9 |
Electricity, heat, gas, and water production and supply industry | … | 3.3 | … | 2.2 |
By economic type |
|
|
|
|
Among them: state-owned holding enterprises | … | 5.4 | … | 4.4 |
Among them: joint-stock enterprises | … | 6.5 | … | 6.8 |
Foreign-invested and Hong Kong, Macao, and Taiwan-invested enterprises | … | 2.8 | … | 4.1 |
Among them: Private enterprises | … | 5.0 | … | 6.5 |
Product Sales Rate (%) | 97.1 | -0.2 Percentage point | 95.6 | -0.4 Percentage point |
Export Delivery Value (100 million yuan) | 12904 | 0.8 | 88153 | 3.6 |
II. Services Production Index | … | 5.8 | … | 5.9 |
III. Fixed-Asset Investment (excluding households) (in 100 million yuan) | … | … | 288229 | 1.6 |
Primary industry | … | … | 5646 | 5.6 |
Secondary industry | … | … | 104455 | 8.9 |
Tertiary industry | … | … | 178128 | -2.3 |
IV. Real Estate Development |
|
|
|
|
Real Estate Development Investment (in 100 million yuan) | … | … | 53580 | -12.0 |
Housing construction area (10,000 square meters) | … | … | 638731 | -9.2 |
New housing construction starts (10,000 square meters) | … | … | 35206 | -19.4 |
Completed housing area (10,000 square meters) | … | … | 25034 | -16.5 |
Sales area of newly built commercial residential properties (10,000 square meters) | … | … | 51560 | -4.0 |
Sales of newly built commercial properties (in 100 million yuan) | … | … | 49566 | -6.5 |
Housing Units for Sale (10,000 square meters) | … | … | 76486 | 3.4 |
Funds in place for real estate development enterprises this year (in 100 million yuan) | … | … | 57287 | -7.5 |
V. Total Retail Sales of Consumer Goods (in 100 million yuan) | 38780 | 3.7 | 284238 | 4.8 |
Among them: Retail sales of consumer goods by units above the designated size | 15214 | 2.8 | 114258 | 5.6 |
By place of operation |
|
|
|
|
Town | 33620 | 3.6 | 246669 | 4.8 |
Rural | 5160 | 3.9 | 37569 | 4.7 |
By consumption type |
|
|
|
|
Food and beverage revenue | 4504 | 1.1 | 31984 | 3.8 |
Among them: Catering revenue from units above the specified quota | 1309 | -0.3 | 9318 | 3.1 |
Retail sales of goods | 34276 | 4.0 | 252254 | 4.9 |
Among them: Retail sales of commodities by units above the designated size | 13905 | 3.1 | 104940 | 5.8 |
6. Total Import and Export Value (in 100 million yuan) | 39102 | 6.7 | 256969 | 3.5 |
Export value | 23077 | 8.0 | 153048 | 7.3 |
Import value | 16026 | 4.8 | 103922 | -1.6 |
7. National Urban Survey Unemployment Rate (%) | 5.2 | 0.0 Percentage point | 5.2 | 0.1 Percentage point |
Unemployment Rate in 31 Major Cities and Towns | 5.2 | -0.1 Percentage point | 5.1 | 0.1 Percentage point |
VIII. Consumer Price Index for Residents | … | 0.0 | … | -0.1 |
Food, tobacco, and alcohol | … | -0.8 | … | -0.3 |
Clothing | … | 1.7 | … | 1.4 |
Residence | … | 0.1 | … | 0.1 |
Household goods and services | … | 1.2 | … | 0.2 |
Transportation and Communication | … | -3.1 | … | -3.0 |
Education, culture, and entertainment | … | 0.9 | … | 0.8 |
Healthcare | … | 0.5 | … | 0.3 |
Other supplies and services | … | 8.0 | … | 6.9 |
9. Producer Price Index for Industrial Products | … | -3.6 | … | -2.9 |
Means of production | … | -4.3 | … | -3.4 |
Mining | … | -14.0 | … | -9.7 |
Raw materials | … | -5.4 | … | -3.7 |
Processing | … | -3.1 | … | -2.8 |
Means of subsistence | … | -1.6 | … | -1.4 |
Food | … | -1.8 | … | -1.6 |
Clothing | … | -0.1 | … | -0.1 |
General daily necessities | … | 0.6 | … | 0.7 |
Durable consumer goods | … | -3.5 | … | -3.1 |
X. Producer Purchase Prices for Industrial Products | … | -4.5 | … | -3.2 |
Note: 1. The growth rates of value-added in industrial enterprises above a designated size and their categorized items are calculated at comparable prices; for other indicators, unless otherwise specified, the growth rates are calculated at current prices. 2. The import and export data are sourced from the General Administration of Customs. 3. The cumulative unemployment rate is the average of monthly figures. 4. Due to rounding, some data in this table may show discrepancies between the total and the sum of its individual components. 5. For more detailed data information, please refer to the official website of the National Bureau of Statistics. | ||||
See the attached figure.




Friendship Link


Tiktok
Organizer: Calcium and Magnesium Fertilizer Branch of China Nitrogen Fertilizer Industry Association
Address:
1807, Building MOMA-9, Wanguo City, Changfeng West Street, Taiyuan City, Shanxi Province
Zip Code:
030000
Telephone:
Fax:
E-mail: